test page
station: SPMN
period: 16 sec
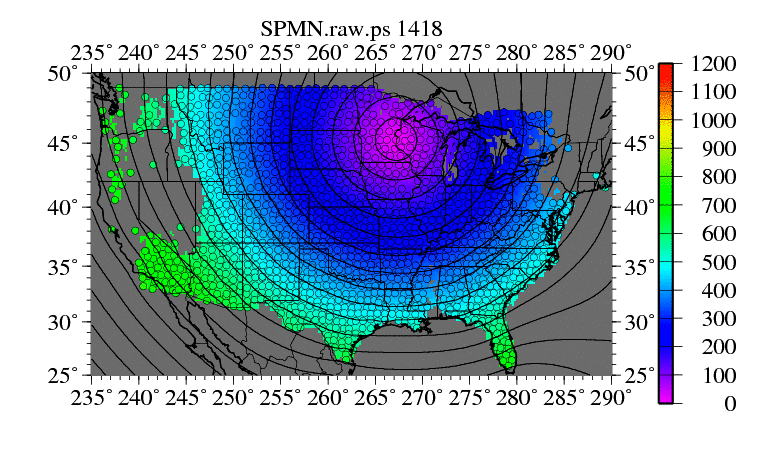 |
Fig.1: Raw measurements of Rayleigh wave phase travel time at each station are plotted as colored circles. The smooth travel time surface and 50 sec contours are also presented. |
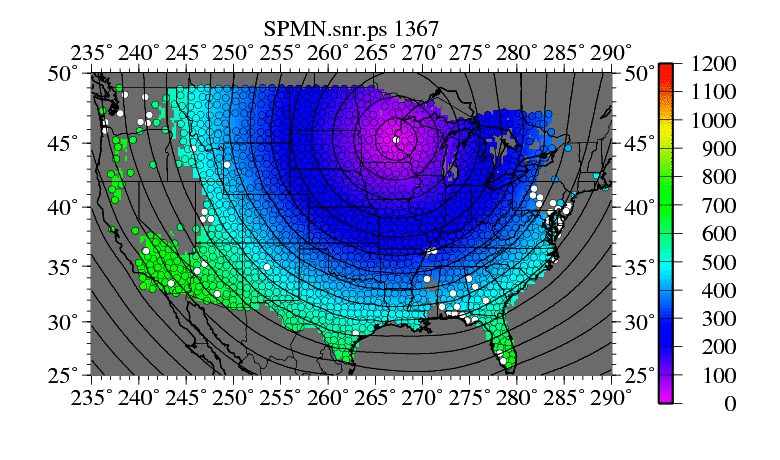 |
Fig.2: Measurements with bad SNR are eliminated and shown as white circles. |
 |
Fig.3: Measurements with 2 pi error have been corrected and marked as red circles; measurements with large error (> 2sec) are eliminated and marked as white triangles. |
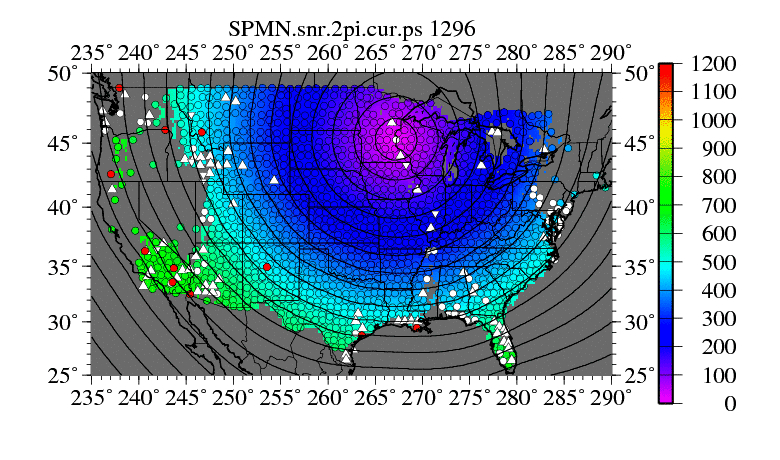 |
Fig.4: Measurements with large curvature are eliminated and shown as inverted triangles. |
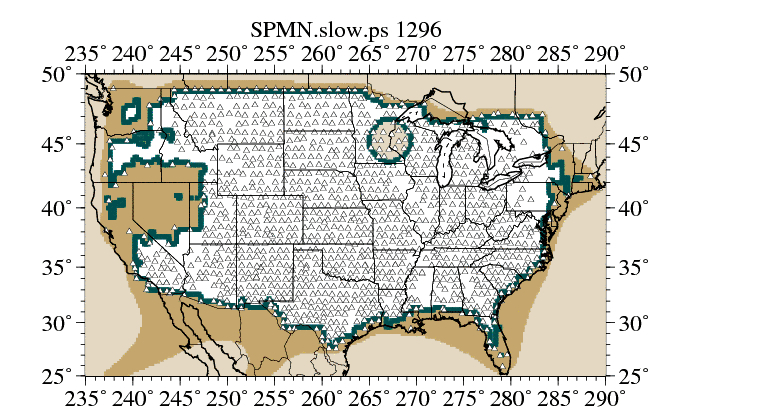 |
Fig.5: The light lemon-chiffon area shows the region that does not get through the Stability criteria; The darker light-golden-rod area shows the region that does not get through 4 quadrads criteria; The turquoise area shows the region that does not get throught the extradinary slowness value criteria. |
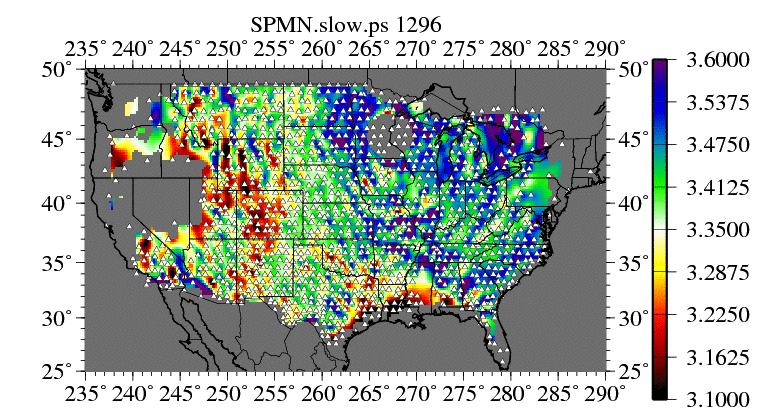 |
Fig.6: Phase velocity computed from Eikonal equation. Stations used to compute this map are shown. |
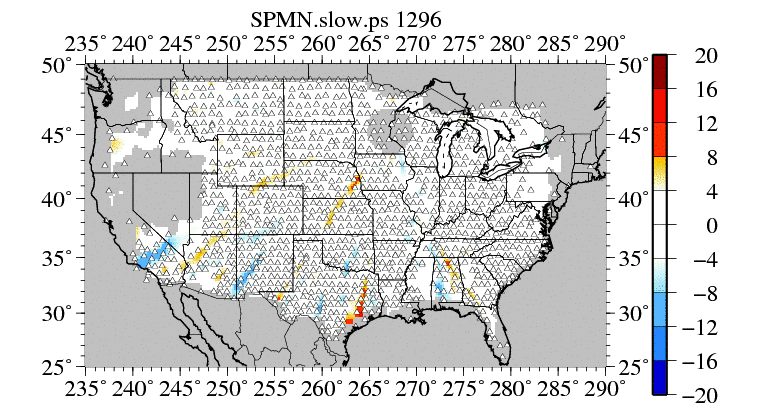 |
Fig.7: Azimuthal perturbation relative to the great-circle path. |