TRACKING THE PROGRESS OF THE USARRAY TRANSPORTABLE ARRAY:
SURFACE WAVE TOMOGRAPHY FROM AMBIENT SEISMIC NOISE AND TELESEISMIC EVENTS ACROSS WESTERN US

Center for Imaging the Earth's Interior
Department of Physics, University of Colorado at Boulder
 

Fan-Chi Lin, Morgan P. Moschetti, Michael H. Ritzwoller, Nikolai M. Shapiro, Yingjie Yang and Weisen Shen

______________________________________________________________________________________________________________________________________

Introduction   |   Phase and Group Velocities   |   3-D Isotropic Model of Western US   |   Azimuthal Anisotropy    |   References   
______________________________________________________________________________________________________________________________________


AMBIENT NOISE TOMOGRAPHY

High resolution ambient noise surface wave tomography is being applied as the USArray Transportable Array (TA) component of Earthscope moves across the western United States. The method is applied both on a monthly basis and to the cumulative TA data set.

Ambient seismic noise contains a significant component of Rayleigh and Love wave energy from which the Green function between pairs of stations can be estimated by cross-correlating long noise sequences. Surface wave group speeds are measured on the estimated Green functions. Early efforts were applied to records from USArray TA stations in Southern California and resulted in the construction of high-resolution short-period (7-18 s) surface Rayleigh wave group dispersion maps and the imaging of the principal crustal geological units in Southern California (Shapiro et al., Science, 307, 1615, 2005).

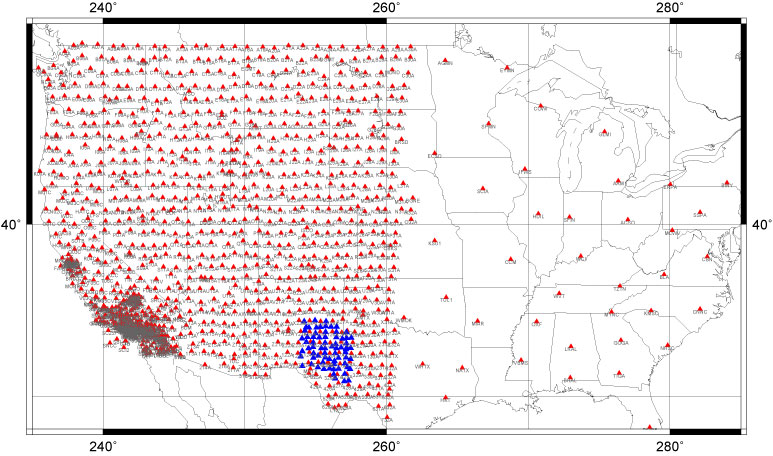
As the spatial coverage of the TA has improved since the inception of USArray, the number of receiver pairs and the resulting inter-station paths have increased proportionately. We are tracking the TA to extend surface wave analysis by constructing cross-correlations between all contemporaneously located stations. The purpose is to obtain short period (7-25 s) Rayleigh wave group and phase speed dispersion curves and velocity maps across the western United States. Newly imaged tomographic features are seen to emerge as TA stations are installed and then resolution (the clarity and reliability of the imaged features) improves.

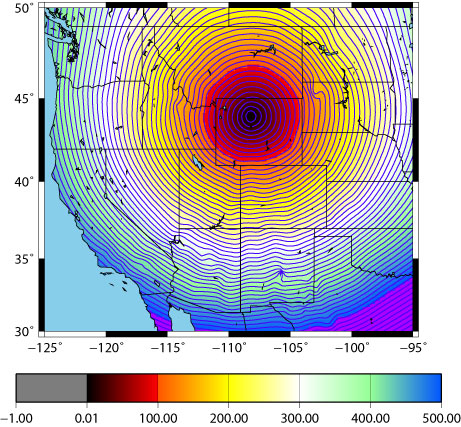
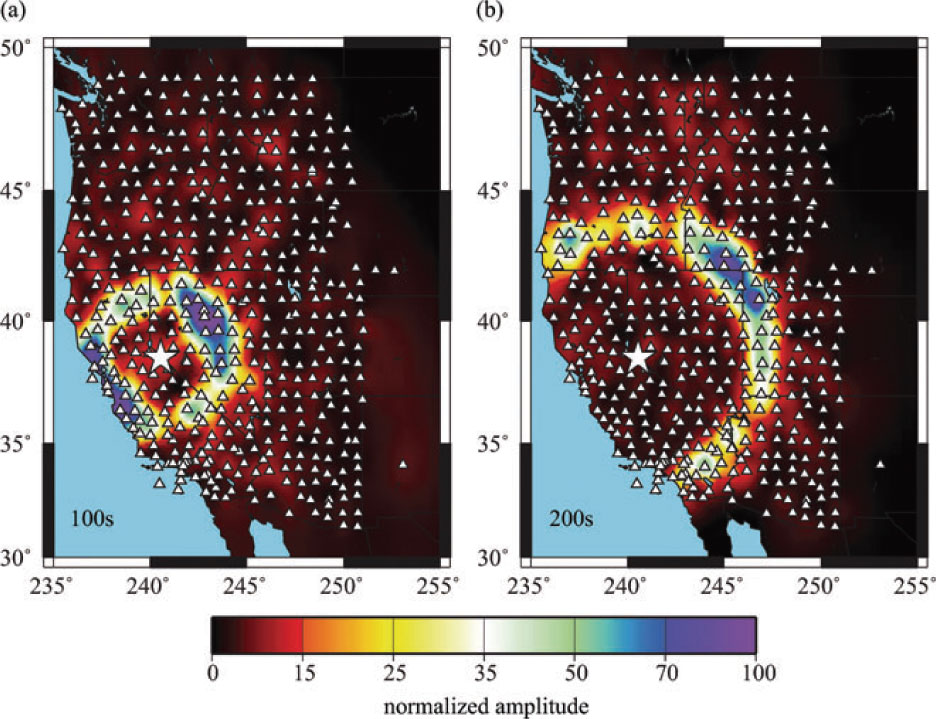
Here we present a sampling of the results, in particular images of Rayleigh wave phase speed maps at 8, 10, 12, 14, 16, 20, and 30 seconds period, resolution maps, and the ray paths used in each tomographic inversion for each month since October 2004. All of them are using a new technique named Eikonal Tomography developed by Fan-chi Lin. The depth to which surface waves are sensitive increases with period; e.g., 8-seconds period Rayleigh group waves are sensitive to a depth of about 10 km whereas the 25-seconds period waves are sensitive to depths of about 30 km. Resolution is reported as twice the standard deviation (two-sigma value, in kilometers) resulting from fitting a 2D Gaussian to the resolution kernel at each point. In addition, maps from the cumulative data are presented together with animations that highlight the improvements achieved as the TA grows across the western US.


DISPERSION MAPS

We present a new method of surface wave tomography based on applying the eikonal equation to observed phase traveltime surfaces computed from seismic ambient noise. The source¨C receiver reciprocity in the ambient noise method implies that each station can be considered to be an effective source and the phase traveltime between that source and all other stations is used to track the phase front and construct the phase traveltime surface. Assuming that the amplitude of the waveform varies smoothly, the eikonal equation states that the gradient of the phase traveltime surface can be used to estimate both the local phase speed and the direction of wave propagation. For each location, we statistically summarize the distribution of azimuthally dependent phase speed measurements based on the phase traveltime surfaces centred on different effective source locations to estimate both the isotropic and azimuthally anisotropic phase speeds and their uncertainties. Fan-chi Lin applied this method using more than 800 USArray across Western US. Here we displayed rayleigh wave speed maps for periods at 10s, 14s, 16s, 20s, 30s. Results of Rayleigh Wave Azimuthal Anisotropy derived by this mothod is shown in Azimuthal Anisotropy

Western US maps

      RAYLEIGH WAVE PHASE VELOCITIES FROM AMBIENT NOISE DATA

      LOVE WAVE PHASE VELOCITIES FROM AMBIENT NOISE DATA


Mid US maps
      RAYLEIGH WAVE PHASE VELOCITIES FROM TELESEISMIC EVENTS
         2008-2009  25s

Isotropic 3-D model

we use surface wave dispersion curves to constrain an isotropic 3-D model for western US. We use a Monte-Carlo scheme and the prior information of the depth of moho. Ambient noise tomography and multiple plane wave earthquake tomography are new methods of surface wave analysis that yield much more highly refined information about the crust and uppermost mantle than traditional surface wave techniques. Applied together to data observed at more than 300 broadband seismic stations from the Transportable Array component of the EarthScope USArray, these methods yield surface wave dispersion curves from 8 to 100 s period across the entire western United States with unprecedented resolution. We use the local Rayleigh wave phase speed curves to construct a unified isotropic 3-D Vs model to a depth of about 150 km. Crustal and uppermost mantle features that underlie the western United States are revealed in striking relief. As the USArray continues to sweep eastward across the United States, the substructure of the entire country will be unveiled.


Azimuthal Anisotropy

We have derived a new method which can extract azimuthal anisotropy information from Eikonal tomography directly.

Western US maps
      RAYLEIGH WAVE AZIMUTHAL ANISOTROPY FROM AMBIENT NOISE DATA

  2006-2009 

12s  24s  36s 


ENERGY RADIATION

Fan-Chi Lin has created example animations showing how energy radiates away from one station to all other stations.

The animations are constructed in the following way. The 10-20 sec band-pass filtered cross-correlations between one common station and all other stations are used to construct the animation. First, the envelope function of each cross-correlation is calculated. For each snapshot, the value of the envelope function for each station at that instantaneous time is assigned to the location of each station. All the assigned values are then fitted with a smooth surface. The cold-blue color represents high of the surface and warm-black color represents low. The signal is observed to propagate outward with time.
energy radiation 

Fan-Chi Lin has created example animations showing how energy radiates away from one station to all other stations.

The animations are constructed in the following way. The 10-20 sec band-pass filtered cross-correlations between one common station and all other stations are used to construct the animation. First, the envelope function of each cross-correlation is calculated. For each snapshot, the value of the envelope function for each station at that instantaneous time is assigned to the location of each station. All the assigned values are then fitted with a smooth surface. The cold-blue color represents high of the surface and warm-black color represents low. The signal is observed to propagate outward with time.
station K09C - mpg


REFERENCES

   PUBLICATIONS

2009

2008

EARLIER THAN 2008

   MEETING ABSTRACTS

CHANGES TO DATA PROCESSING

As this is a new technique, we are still determining optimal data processing procedures. The posted results reflect this fact. The monthly data stacks are processed using the procedure which was current at the time of processing. The cumulative stacks are processed using the most up-to-date procedure.

Summary of processing procedures and changes:


     This project is funded by the National Science Foundation - EAR 0450082.
All data was obtained from the IRIS Data Management Center.