 |
|
TRACKING THE PROGRESS OF THE USARRAY TRANSPORTABLE ARRAY:
SURFACE WAVE TOMOGRAPHY FROM AMBIENT SEISMIC NOISE AND TELESEISMIC EVENTS ACROSS WESTERN US
|
Center for Imaging the Earth's Interior
Department of Physics, University of Colorado at Boulder |
|
Fan-Chi Lin, Morgan P. Moschetti, Michael H. Ritzwoller, Nikolai M. Shapiro, Yingjie Yang and Weisen Shen
|
______________________________________________________________________________________________________________________________________
Introduction |
Phase and Group Velocities |
3-D Isotropic Model of Western US |
Azimuthal Anisotropy |
References
______________________________________________________________________________________________________________________________________
3-D Isotropic Model
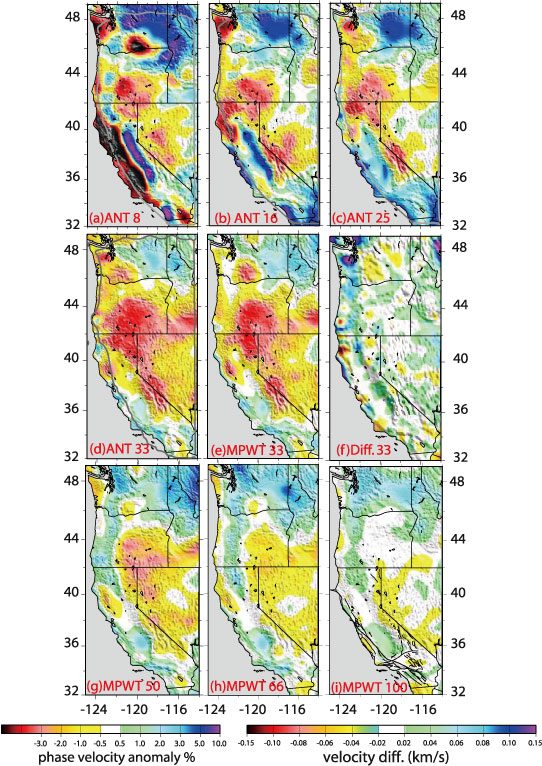
Ambient noise tomography and multiple plane wave earthquake tomography are new
methods of surface wave analysis that yield much more highly refined information about
the crust and uppermost mantle than traditional surface wave techniques. Applied together
to data observed at more than 300 broadband seismic stations from the Transportable
Array component of the EarthScope USArray, these methods yield surface wave
dispersion curves from 8 to 100 s period across the entire western United States with
unprecedented resolution. We use the local Rayleigh wave phase speed curves to construct
a unified isotropic 3-D Vs model to a depth of about 150 km. Crustal and uppermost
mantle features that underlie the western United States are revealed in striking relief. As
the USArray continues to sweep eastward across the United States, the substructure of the
entire country will be unveiled.
Surface Wave Dispersion Maps
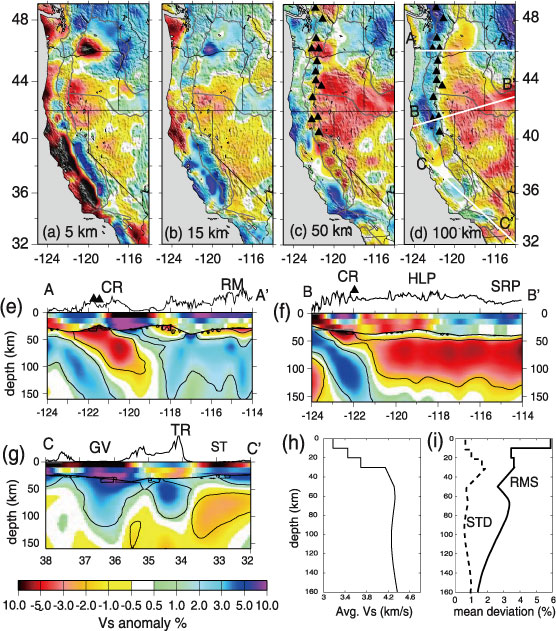
Shear Wave Velocity Model
(a)–(d) Shear wave speed maps at depths of 5, 15, 50 and 100 km. (e)–(g) Vertical cross
sections of shear wave speed along three profiles delineated by the white lines in Figure 5d. Black
contours outline the ‘‘persistent’’ upper mantle velocity anomalies. Topography is overplotted above
individual cross sections with major tectonic units labeled using abbreviations defined in Figure 1
caption. The black triangles in Figures 5c–5f represent active volcanoes in the Cascade Range. Shear
velocity anomalies are computed relative to the average 1-D model across the region plotted in Figure 5h.
(h) The average 1-D model across the study region. (i) The standard deviation (STD) of the ensemble of
acceptable models (i.e., average uncertainty, dashed line) and the root mean square (RMS) of the velocity
perturbations (solid line) taken across the entire region are shown.
CIEI Research Home
CIEI Research, Ambient Noise Surface Wave Tomography